Dashboard
A snapshot of real time information providing key HSE insight to help you identify trends.
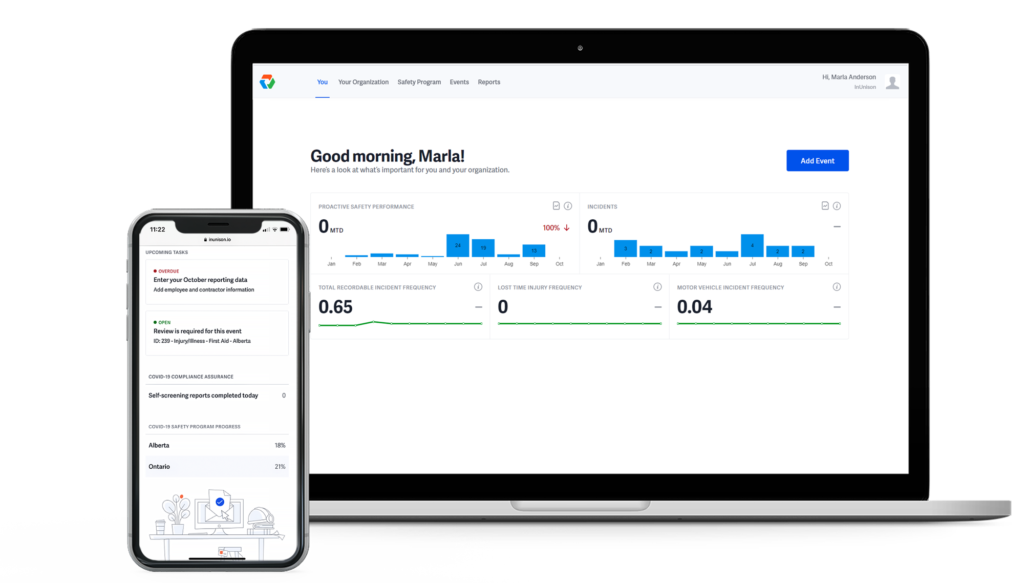
View Safety Performance at a Glance
Rolled up graphs of proactive safety performance and incidents as well as COVID-19 compliance provide a snapshot of your organization’s safety performance.
Clean and Easy to Understand
Easy to read graphics let you know what’s happening in your organization and help you quickly identify trends. Drill down as required to find out specifics.
Notifications of Upcoming Tasks
Never worry about missing an email notification, all assigned tasks are listed here so you can quickly get through your to-do list.
KPIs automatically calculated for you (TRIF, LTIF, MVIF)
These important safety metrics are right at your fingertips with sparkpoint graphs noting past performance to provide quick reporting to clients, management and board members.
For more information on how to use the dashboard to access reports,